
The changing student profile
Have you noticed that there are far more young women than young men in your courses? Is this just your experience or does it reflect changes in the profile of Dawson students? Have there been other important changes in the demographic profile of our students since 1990?
Has there been an increase in the percentage of students who are enrolled in technical programs?
Are students more successful now than they were 30 years ago?
These are the types of questions that the Quality Assurance and Planning Office (QAPO) asks as a regular part of its operations. It shares the results of this research with the academic administration and program committees through the preparation of program and profile annual reviews. The data is also on CARS (Customized Academic Reporting System), a database that is maintained by QAPO and which can be found on SharePoint.
Student profile
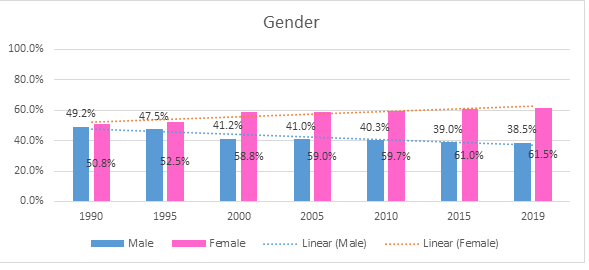
If you answered “yes” to the first question, you are right. For the college as a whole, the percentage of female students has increased since 1990 and there has been a corresponding decrease in the percentage of males. Some programs remain heavily male-dominated, such as the engineering programs, while the health programs are still female-dominated. The change in the gender profile of our students mirrors what has been happening at the post-secondary level across Canada. According to the latest data from Statistics Canada, women represented 56.2% of post-secondary enrolment in 2016-2017.
Graph 1 – Dawson gender profile
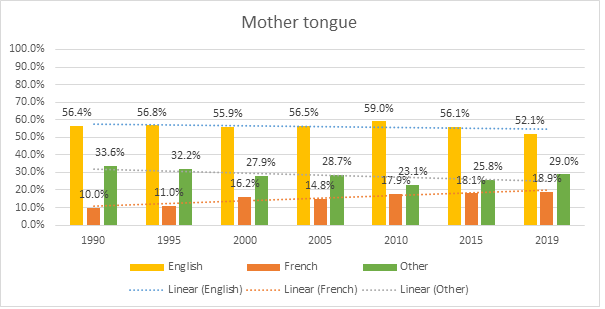
With respect to the mother tongue of our students, English is still the predominant language, but the percentage of students whose mother tongue is French has increased. The percentage of students with a mother tongue other than English or French has slightly decreased since 1990.
Graph 2 – Mother tongue
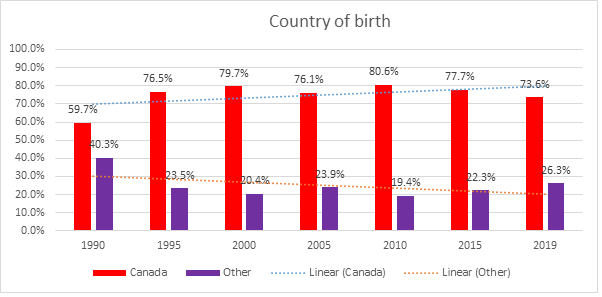
In 1990, a much higher percentage of students were born outside of Canada compared to the situation that has prevailed, with minor variations, from 1995 to 2019.
Graph 3: Country of birth
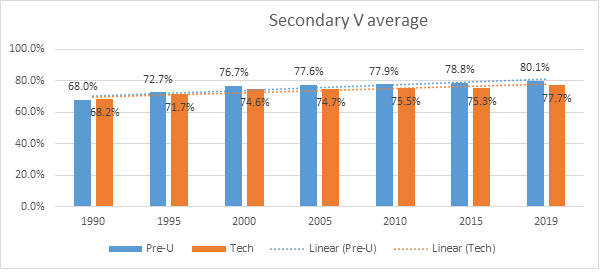
What about students’ incoming Secondary V average? Has it been increasing since 1990? The answer is a resounding ”yes” in both the pre-university and technical sectors.
Graph 4: Secondary V average
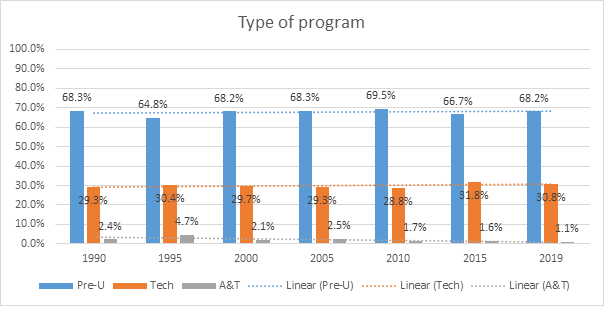
Have there been any notable changes in the type of program students enrol in? Not according to the data shown in Graph 5. The distribution of enrolment between the pre-university and technical sectors has remained steady since 1990. However, the percentage of students in Accueil and Transition (A&T) programs, such as Explorations Science and Developmental Science, or the previously offered Preparatory Arts program, has decreased since 1995.
Graph 5: Type of program
Student success at Dawson
The Quality Assurance and Planning Office keeps track of a set of key performance indicators (KPIs) that measure how Dawson students are doing overall, as well as by sector, program and profile. This set of KPIs is standard across the college network in Quebec. The KPIs shown in the following graphs are cohort-based, which means that a group of students enrolled in a given semester are tracked together throughout their time at Dawson.
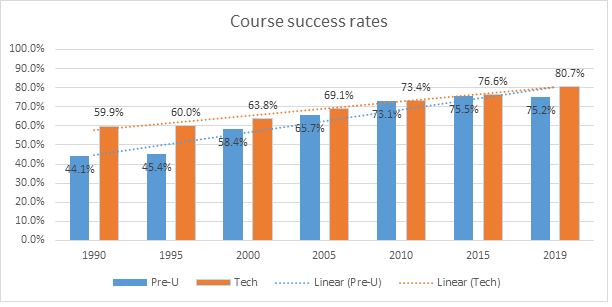
One early indicator of how students are performing is the course success rate. The course success rate is the percentage of students who pass all their courses in the first semester. The data shown in Graph 6 shows a steady increase in this important early indicator of student success.
Graph 6: Course success rates
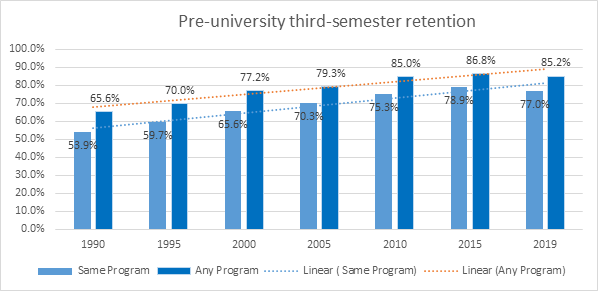
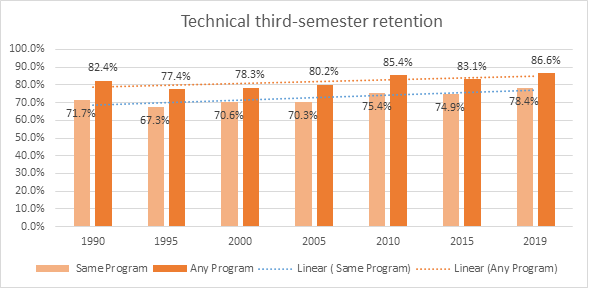
Another important indicator of early success is third-semester retention. This indicator tracks the percentage of students who re-enrol in the third semester in the “same program”. “Any program” retention means that students re-enrol in the third semester, whether in their original program or another program. Graphs 7 and 8 show data for third-semester retention for the pre-university sector and for the technical sector.
Graph 7: Third-semester retention in the pre-university sector
Graph 8 – Third-semester retention in the technical sector
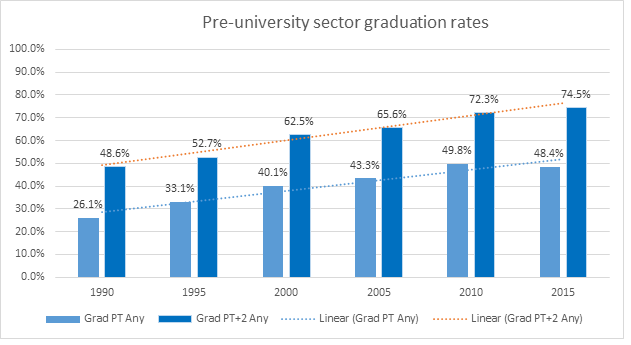
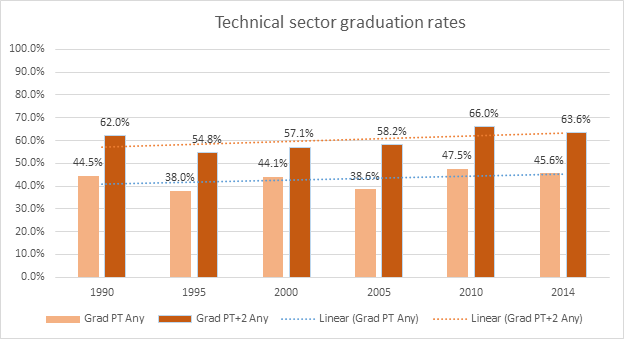
The last important indicator that we will look at in this article is graduation. QAPO tracks graduation in prescribed time (PT), that is, two years for pre-university programs and three years for technical programs. It also tracks graduation in prescribed time plus 2 years (PT+2), which is four years for pre-university students and five years for technical program students. The reality of college life is that incoming students often do not know what they want to do with their lives so they will take longer to graduate, especially if they change programs. Tracking graduation in prescribed time plus 2 takes this reality into account. Graphs 9 and 10 look at graduation in prescribed time and in prescribed time plus 2 years for the pre-university sector and the technical sector in “any program.”
Graph 9: Graduation rates in the pre-university sector – any program
Graph 10: Graduation rates in the technical sector – any program
Key take-aways
The key takeaways from the data shown are:
- The percentage of female students has increased steadily since 1990 and currently there are six female students for every four male students at Dawson. The incoming average of Secondary V students has also increased steadily in the pre-university and technical sectors since 1990. There has not been much change in the students’ mother tongue and country of birth in the last 30 years. Almost 70% of the students enrolled at Dawson are in pre-university programs and this has not changed since the 1990s.
- Two important indicators of early success – course success rates and third semester retention rates – have steadily increased since 1990.
- Graduation rates, in both prescribed time and prescribed time plus two years, have steadily increased in the pre-university sector since 1990, but these two measures of graduation have not changed in any meaningful way in the technical sector.
Looking ahead
In a future issue of Academic Matters, the Quality Assurance and Planning Office will present data on graduates’ rates of acceptance into and success at university and the employment of Dawson graduates.
See also the article “Who are the Gen Z Phigitals?” in this issue.
